
6 min
Mindset & Strategy
Strategy Meets Speed
As a manager, I always had brilliant strategies. What drives me now: turning them into working prototypes myself – in one evening instead of ten weeks. That's my new superpower.
10 March 2026Read
An honest case study on how I built an enterprise-level business dashboard for an established food brand using Agentic AI – and what that means for corporate work.
Philipp Kendzior
Head of Data, Continental Europe
Julia and I are a power couple – with clearly defined strengths and deliberately separate roles. Julia is the Crunchy Queen: recipe developer, brand builder, CEO and the face behind the product. I'm the valuable support behind the scenes: the person who makes sure the business doesn't just taste good, but also scales. But I'm not the boss – that's her.
When Julia built Crunchy Queen – a brand that now looks back on over 10 years of history – I was involved from the very beginning, not as a silent observer, but as an active co-builder. I helped build the entire e-commerce system: from order processing to logistics to AI-powered accounting, everything runs automated today. I'm proud of that. But it was Julia's decision, Julia's business – I was the technician who made her vision workable.
But at some point, that system was built. Stable, automated, scalable. And Julia had a clear demand: she wanted to understand her data. Not someday, not in a months-long project – but now. The questions she asked were the questions of any good entrepreneur: which products really contribute to the margin? Who are my most loyal customers? Where am I losing people in the purchase process?
The data was there. But how to use it without investing whole days? That was the real challenge.
I want to be honest here, because I think many of you know this feeling.
I'm Head of Data at Sodexo Continental Europe. My days are full. Really full. Meetings, decisions, strategic alignments, international teams – I work from my home office, but that doesn't mean my head is clear after the last call of the day. And then spending hours more on a side project? That sounds like burnout, not growth.
Julia and I therefore made an agreement: maximum 60 minutes in the evening after work. No more. That leaves enough time for us as a couple, for recovery, for life outside of work. And yet we can still grow together.
That sounds like little. And without the right tool, it would be too little. But Manus has changed that equation.
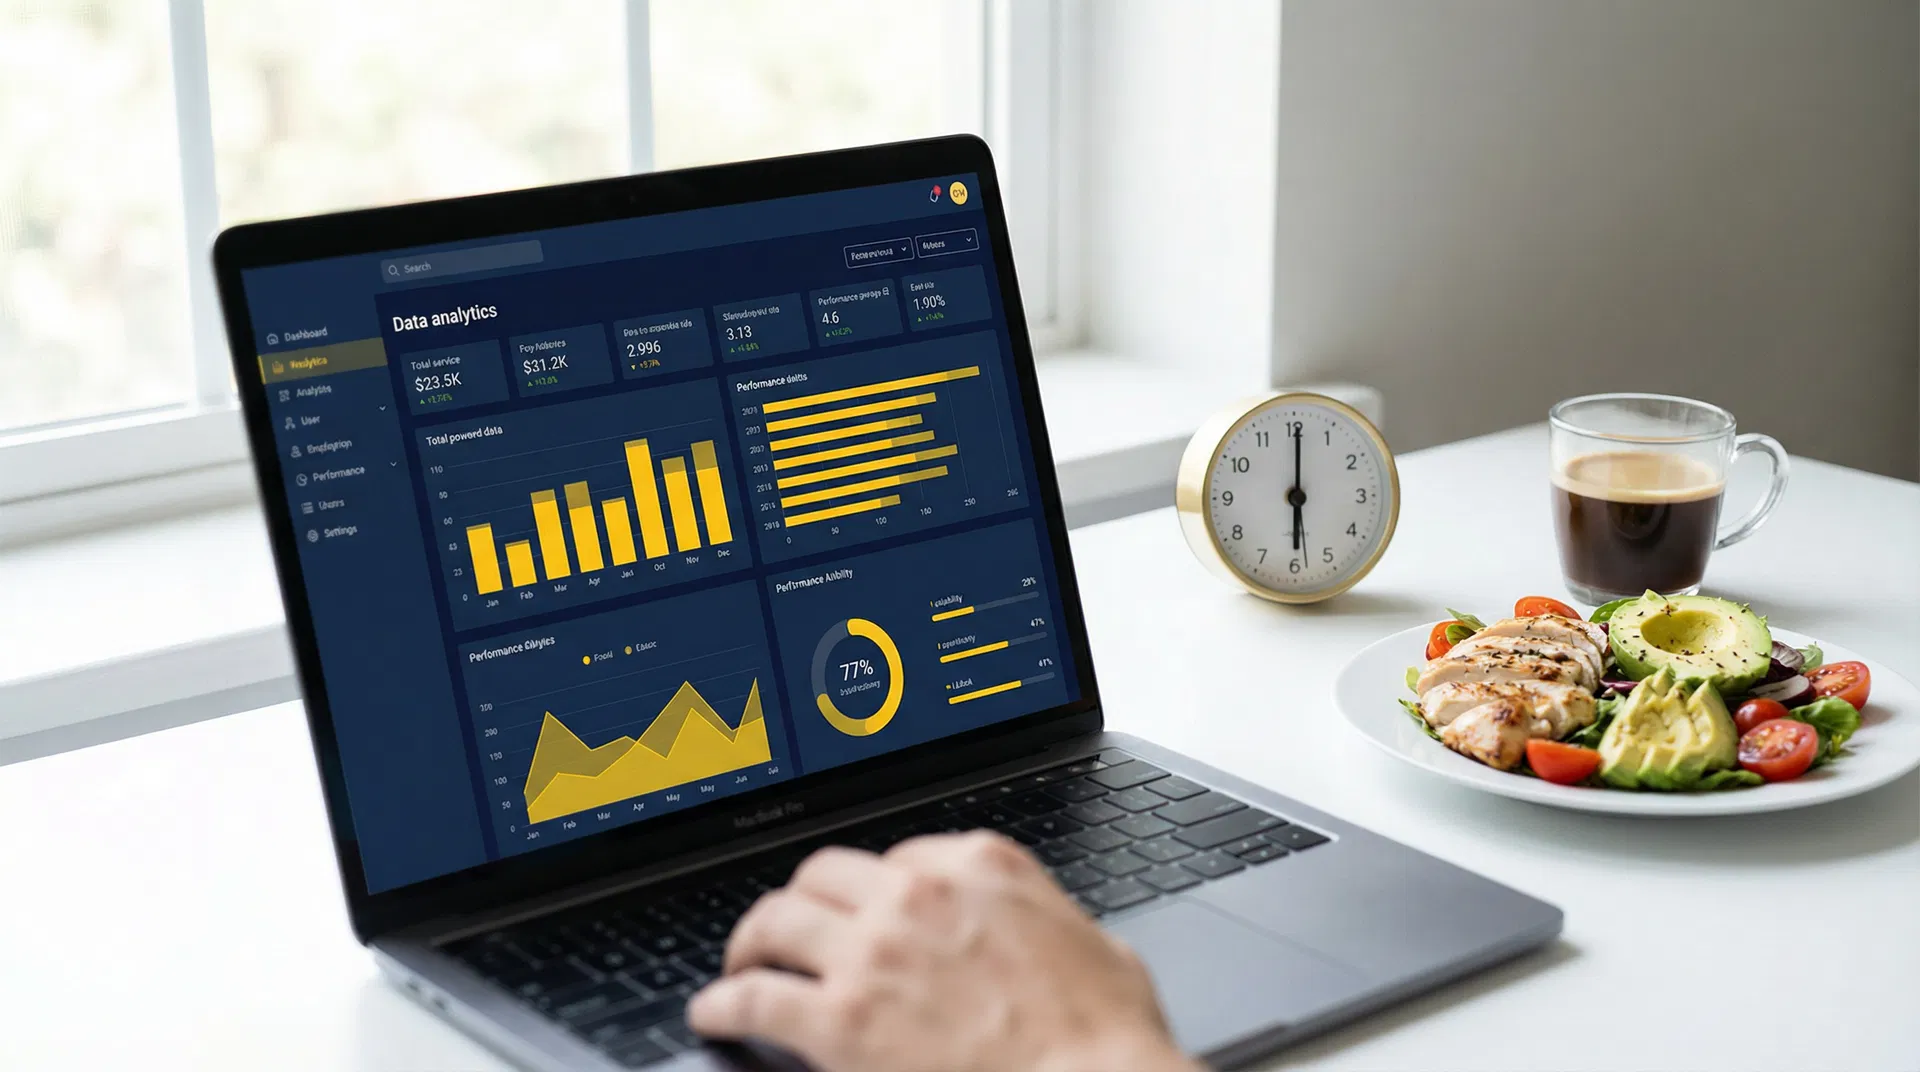
The result: a business dashboard that holds its own against what I see in my corporate day-to-day at Sodexo. Built across several 60-minute sessions, with Manus as my sparring partner. And the most interesting part: it has taught me more about the practical application of AI in business than any course, book or seminar.
This is the story of that project – and why it's far more than a hobby.
Crunchy Queen is not a toy. It's an established food brand that has been on the market for over 10 years, has built a loyal customer base and has clearly positioned itself in its niche. And like many established brands, it now faces a new challenge: after the COVID e-commerce boom that briefly boosted many online retailers, the focus is now on growing sustainably again. No longer riding the wave – but actively steering.
And just as in any other business: if you don't understand your data, you're flying blind.
The starting situation was typical for an established, growth-oriented company: data existed – in Gambio (the current shop system), in the accounting system, in the marketing tools – but it was fragmented, disconnected and didn't provide clear answers to the really important questions:
Which products are real revenue drivers and which are just along for the ride? Which customers come back again and again, and which buy once and disappear? Through which channels do the most valuable customers arrive? And: what does the pricing strategy need to look like to grow profitably?
Every manager knows these questions. In a corporation, there are teams, budgets and months-long projects for this. At Crunchy Queen, there's: me, across several 60-minute sessions, with Manus.
I want to be specific, because specificity is what distinguishes this blog from generic AI hype articles. Here are the central modules of the dashboard I implemented:
This sounds simple, but it isn't. Everyone knows the question: which products are performing well, which aren't? But the really relevant question is more complex: which products are revenue winners but margin losers? Which sell little but have a loyal fan base with high repeat purchase potential?
The dashboard visualises products in a dynamic matrix that simultaneously maps revenue, margin, sales frequency and customer loyalty. The result is not a simple bestseller list, but a strategic management tool: which products should be actively pushed? Which need a price or positioning adjustment? And which should quietly disappear from the range?
This is, for me, the heart of any e-commerce dashboard. Not all customers are equal – and knowing who your most valuable customers are is the key to sustainable growth.
The dashboard calculates the Customer Lifetime Value (CLV) for each anonymised customer group and automatically segments the customer base into strategically relevant groups: the loyal regulars with high CLV, the occasional buyers with potential, the one-time buyers who could be reactivated, and the customers who have quietly churned.
This segmentation is not just a pretty graphic. It is the foundation for every marketing decision: where do I invest advertising budget? Who do I target with which message? And where does a reactivation campaign make sense?
Where do my best customers come from? This question is crucial in e-commerce – and the answer is rarely as simple as "Instagram" or "Google".
The dashboard tracks the customer journey across all relevant touchpoints and answers questions like: which channel brings customers with the highest CLV? Where in the funnel am I losing potential customers? Which combination of first contact and conversion trigger leads to the most valuable customer relationship?
The result is a clear picture of where marketing budget really works – and where it evaporates.
Pricing is one of the most difficult tasks in e-commerce. Too high, and you lose customers. Too low, and you destroy margin. Most small businesses solve this problem intuitively – or not at all.
The pricing engine in the dashboard analyses three dimensions simultaneously: actual production costs, historical price elasticity (how do customers react to price changes?) and the willingness to pay of different customer segments. The result is concrete price recommendations per product and customer segment – not gut-feel decisions, but data-driven scenarios.
This is the feature that surprised me the most. I integrated two specialised AI bots into the dashboard:
The market strategy bot continuously analyses the dashboard data and proactively generates strategic recommendations. It thinks like an experienced e-commerce consultant: it recognises patterns, identifies opportunities and warns of risks – before they become problems.
The pricing strategy bot specialises in price optimisation. It takes into account seasonality, competitive signals and the historical reactions of the customer base to make concrete price adjustment suggestions.
Both bots are not generic ChatGPT interfaces. They are deeply integrated into the data structure of the dashboard and always speak about the specific situation of Crunchy Queen.
Now comes the part that makes this project truly valuable for me – and the reason I'm documenting this publicly.
I didn't build this dashboard to help my wife (although that's obviously nice). I built it to learn. Specifically: to understand how to design, build and enrich highly complex, data-driven dashboards with AI functions – without ever having to enter sensitive corporate data into an AI tool.
This is the crucial point: I use private, anonymised data as a safe training ground for conceptual competencies that I then apply in the corporate world.
The questions I answered with the Crunchy Queen dashboard are structurally identical to the questions we ask at Sodexo: which locations are revenue winners, which are losers? Which customer groups have the highest value? Where are we losing customers in the funnel? How do we optimise prices across different market segments?
The difference: with the Crunchy Queen dashboard, I built a working prototype in a weekend. In the corporate world, the same project would have required a six-figure budget request, a three-month tender process and half a year of development time.
That is rapid prototyping as a manager. That is the lever I mean.
If you're reading this as a leader or strategist, my message is clear: you don't need a startup or a wife with a granola business to take this learning path.
You need a safe playing field. That could be a small personal project, a volunteer engagement, a hobby that produces data. Anything that allows you to try out the concepts you need professionally in a risk-free environment.
The tools are there. The learning curve is steeper than ever. And the managers who start building now will have a competency in two years that will fundamentally change their teams and their companies.
I'm in. Are you?
---
By the way: Crunchy Queen is about to take its next big step – migrating from Gambio to Shopify. And of course I'll be tackling that with Manus too. How to migrate a complete e-commerce platform with AI support without disrupting live operations – that will be the subject of a dedicated post. Stay tuned.
Did you enjoy this post?
Connect on LinkedIn and join the conversation.
Keep Reading
As a manager, I always had brilliant strategies. What drives me now: turning them into working prototypes myself – in one evening instead of ten weeks. That's my new superpower.

A BMW i4 that never arrived. A personal frustration. And a niche site with 399+ car models, daily crawls and SEO dominance – built in my spare time with Manus AI.
How I built a fully functional AI-Driven Food Data Analytics tool in 30 minutes using simulated FMS data, an external crawl and Manus AI – and what this means for enterprise managers.